-
 Excel workbook preview
Six Sigma and Statistical Quality
DPMO and Sigma Level Calculator
3 downloads per free account, no card needed.
Who this is for
A Green Belt or quality manager asked to state process performance as DPMO and sigma level for a charter, a tollgate or a management report.
What is inside
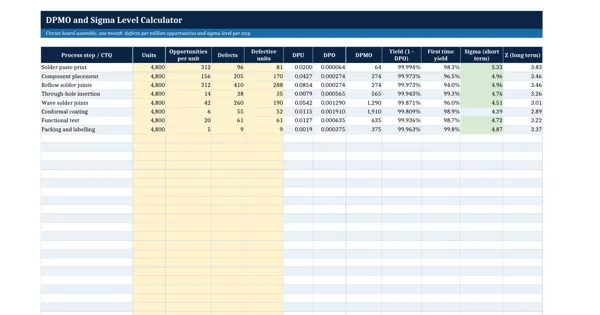
- 8 sample process steps with units, opportunities per unit, defects and defective units
- DPU, DPO and DPMO = defects / (units x opportunities) x 1,000,000, live
- Short term sigma with the conventional 1.5 shift and long term Z without it
- First time yield per step and rolled throughput yield across steps
- Overall DPMO and sigma for the whole process in a totals row
- Sigma to DPMO conversion table from 1.0 to 6.0 computed with NORMSDIST
How to use it: Define what counts as an opportunity before you count, keep it the same over time, and type units, opportunities and defects for each step into the yellow cells.
Files & formats
- XLSXdpmo-sigma-level-calculator.xlsx12 KB
Opens in Microsoft Word or Excel, Google Docs or Sheets and LibreOffice. Delivered instantly from your browser.
Free downloads & full access
Every account gets 3 free downloads. Re-downloading a template you already have does not count. This template on its own is $17.99, and buying it keeps your free downloads for something else. Full access is a one-time $249 for all 300 templates, for life.
Bought with a different email? Open your account and enter your order number.
Licence
Use and adapt the document inside your own organisation or for your own clients. Do not resell or republish the templates themselves.