-
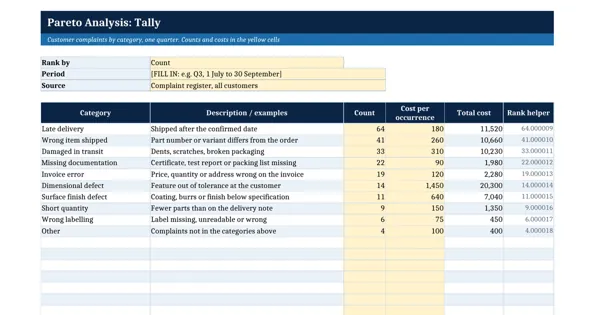 Excel workbook preview
Six Sigma and Statistical Quality
Pareto Analysis Template (with Chart)
3 downloads per free account, no card needed.
Who this is for
A quality manager who has a pile of complaint or defect records and has to show the boss which few categories to attack first.
What is inside
- Tally sheet: 10 complaint categories for one quarter with count and cost per occurrence
- Switch between ranking by count and ranking by cost with one dropdown
- Live sort with formulas: no manual sorting when the counts change
- Percent, cumulative percent and A (vital few), B and C class for every category
- Pareto chart: bars for the value and a cumulative percent line on a second axis
- 20 blank category rows and a total check that the ranking adds up
How to use it: Pick one measure that matters (count or cost), use one period and one source, and type each category once; the Pareto sheet sorts itself.
Files & formats
- XLSXpareto-chart-template.xlsx14 KB
Opens in Microsoft Word or Excel, Google Docs or Sheets and LibreOffice. Delivered instantly from your browser.
Free downloads & full access
Every account gets 3 free downloads. Re-downloading a template you already have does not count. This template on its own is $17.99, and buying it keeps your free downloads for something else. Full access is a one-time $249 for all 300 templates, for life.
Bought with a different email? Open your account and enter your order number.
Licence
Use and adapt the document inside your own organisation or for your own clients. Do not resell or republish the templates themselves.