-
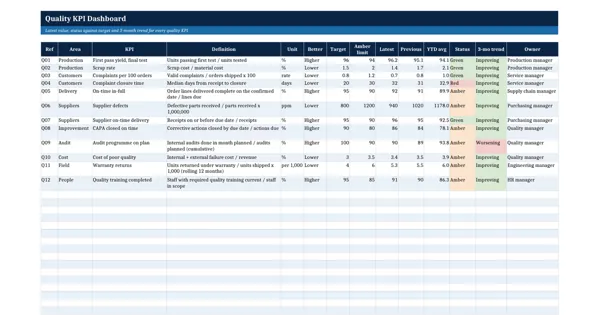 Excel workbook preview
Excellence and Strategy (Baldrige, Hoshin)
Quality KPI Dashboard
3 downloads per free account, no card needed.
Who this is for
A quality manager who must present the monthly quality numbers to the leadership team and show at a glance what is on target, what is slipping and why.
What is inside
- 12 sample quality KPIs from first pass yield to complaint closure time, each with a definition
- Monthly data sheet with 10 months of sample values
- Live latest value, previous month and year-to-date average pulled from the data sheet
- Live Green/Amber/Red status against target and amber limit, direction aware
- Live 3-month trend: last three months against the three before
- Status count of green, amber and red KPIs on the dashboard
How to use it: Replace the sample KPIs with the ones your objectives use, keep the definitions exact, and add each month's value on the Monthly data sheet; the dashboard updates itself.
Files & formats
- XLSXquality-kpi-dashboard-template.xlsx14 KB
Opens in Microsoft Word or Excel, Google Docs or Sheets and LibreOffice. Delivered instantly from your browser.
Free downloads & full access
Every account gets 3 free downloads. Re-downloading a template you already have does not count. This template on its own is $17.99, and buying it keeps your free downloads for something else. Full access is a one-time $249 for all 300 templates, for life.
Bought with a different email? Open your account and enter your order number.
Licence
Use and adapt the document inside your own organisation or for your own clients. Do not resell or republish the templates themselves.
More in Excellence and Strategy (Baldrige, Hoshin)
Excellence and Strategy (Baldrige, Hoshin)
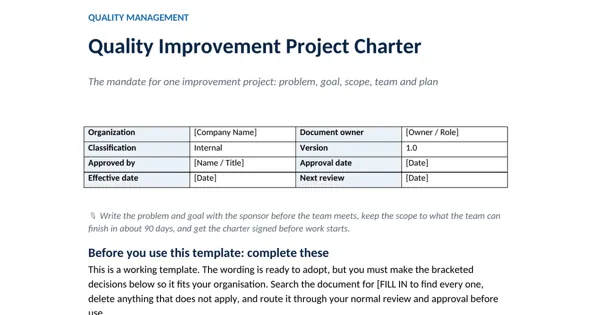
Quality Improvement Project Charter
Excellence and Strategy (Baldrige, Hoshin)
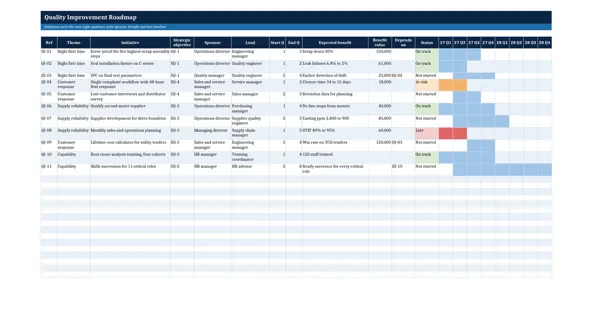
Quality Improvement Roadmap
Excellence and Strategy (Baldrige, Hoshin)
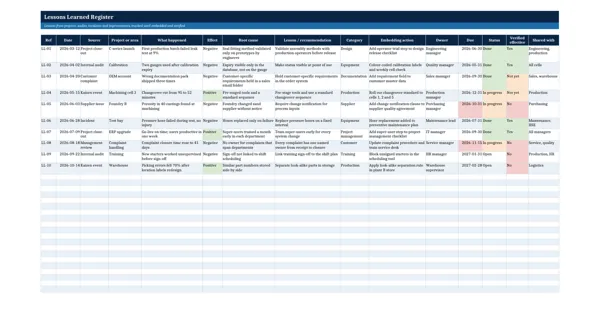
Lessons Learned Register
Excellence and Strategy (Baldrige, Hoshin)