-
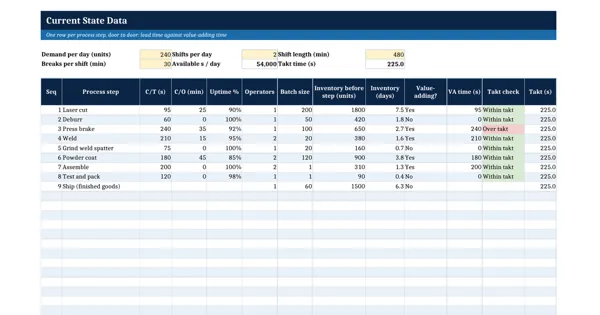 Excel workbook preview
Lean and Continuous Improvement
Value Stream Mapping Data Worksheet Template (Lead Time vs Value-Added Time)
3 downloads per free account, no card needed.
Who this is for
An engineer or CI lead building a current state map who needs the data box numbers and the timeline before the mapping workshop.
What is inside
- Nine sample process steps from a sheet metal cabinet line
- Takt time from demand, shifts and breaks, live formula
- Inventory converted to days of demand for every step
- Summary of lead time, value-added time and process cycle efficiency
- Bottleneck step found automatically and steps over takt flagged red
- Chart of cycle time per step against the takt line
How to use it: Fill the demand and shift cells, record each step from your gemba walk, and read lead time against value-added time on the Summary.
Files & formats
- XLSXvalue-stream-mapping-data-worksheet-template.xlsx13 KB
Opens in Microsoft Word or Excel, Google Docs or Sheets and LibreOffice. Delivered instantly from your browser.
Free downloads & full access
Every account gets 3 free downloads. Re-downloading a template you already have does not count. This template on its own is $17.99, and buying it keeps your free downloads for something else. Full access is a one-time $249 for all 300 templates, for life.
Bought with a different email? Open your account and enter your order number.
Licence
Use and adapt the document inside your own organisation or for your own clients. Do not resell or republish the templates themselves.
More in Lean and Continuous Improvement
Lean and Continuous Improvement
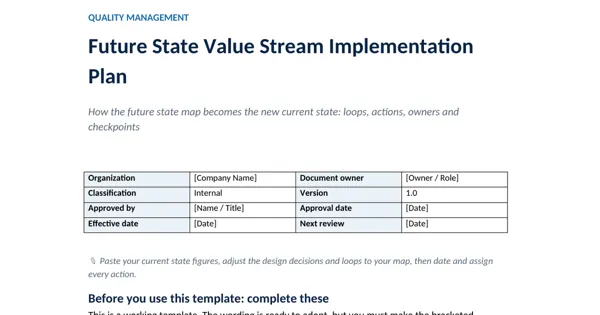
Future State Value Stream Implementation Plan Template
Lean and Continuous Improvement
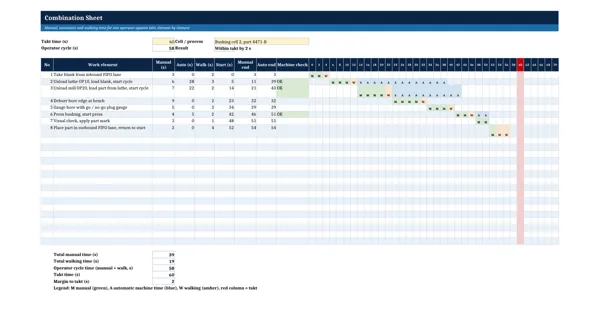
Standard Work Combination Sheet Template
Lean and Continuous Improvement
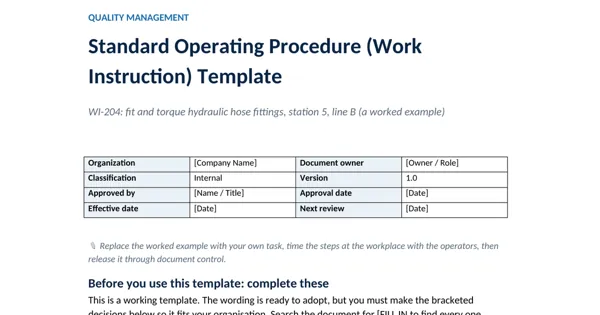
Standard Operating Procedure (Work Instruction) Template
Lean and Continuous Improvement