-
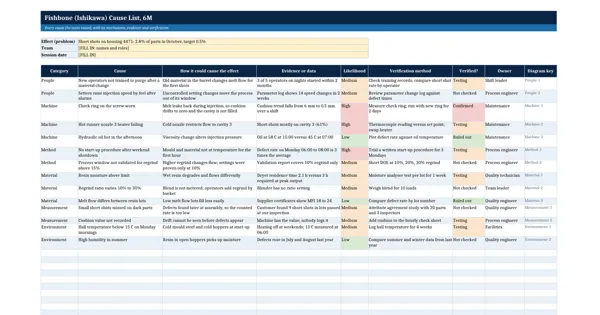 Excel workbook preview
Six Sigma and Statistical Quality
Fishbone (Ishikawa) Diagram Template (6M)
3 downloads per free account, no card needed.
Who this is for
A team lead running a root cause session after a customer complaint or a scrap spike, who must show the auditor or the boss which causes were considered and checked.
What is inside
- Six categories: people, machine, method, material, measurement and environment
- Worked example: short shots on an injection moulded housing, 14 causes listed
- Each cause has a mechanism, evidence, likelihood, verification method and verified status
- Diagram sheet draws the fishbone and fills up to 5 causes per bone by formula
- Verified causes marked on the diagram so the team sees what is fact and what is opinion
- 16 blank cause rows, dropdowns and colour for likelihood and verification
How to use it: Write the effect as a measurable problem statement first, brainstorm causes under each of the six bones, then plan a check for every cause rated high or medium.
Files & formats
- XLSXfishbone-diagram-template.xlsx12 KB
Opens in Microsoft Word or Excel, Google Docs or Sheets and LibreOffice. Delivered instantly from your browser.
Free downloads & full access
Every account gets 3 free downloads. Re-downloading a template you already have does not count. This template on its own is $17.99, and buying it keeps your free downloads for something else. Full access is a one-time $249 for all 300 templates, for life.
Bought with a different email? Open your account and enter your order number.
Licence
Use and adapt the document inside your own organisation or for your own clients. Do not resell or republish the templates themselves.
More in Six Sigma and Statistical Quality
Six Sigma and Statistical Quality
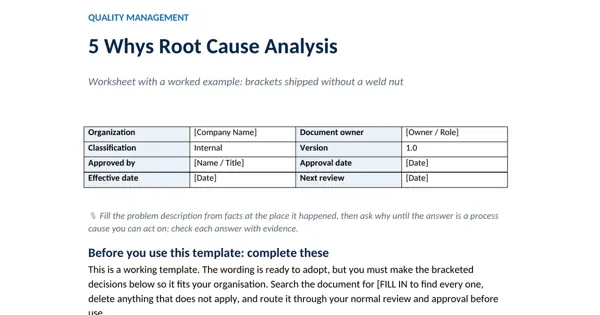
5 Whys Root Cause Analysis Template
Six Sigma and Statistical Quality
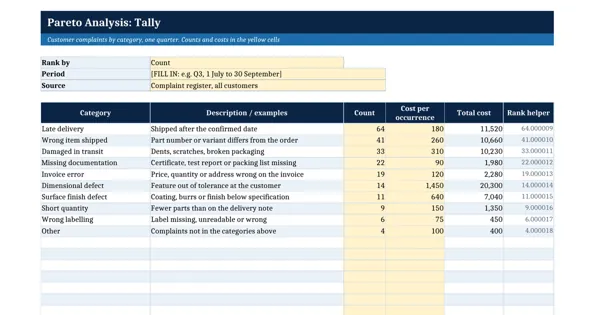
Pareto Analysis Template (with Chart)
Six Sigma and Statistical Quality
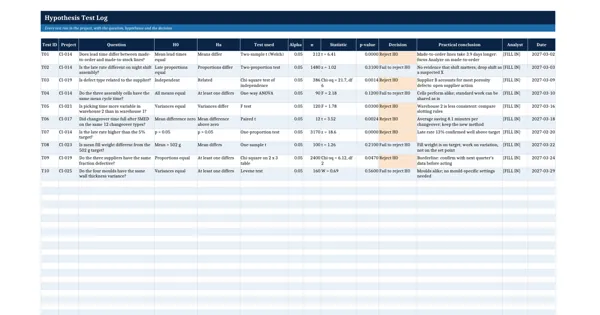
Hypothesis Test Selection Guide and Test Log
Six Sigma and Statistical Quality