-
 Excel workbook preview
Six Sigma and Statistical Quality
p-Chart Template for Defectives
3 downloads per free account, no card needed.
Who this is for
A supervisor or quality engineer asked to show whether the daily defective rate is stable or really getting worse, before anyone reacts to one bad day.
What is inside
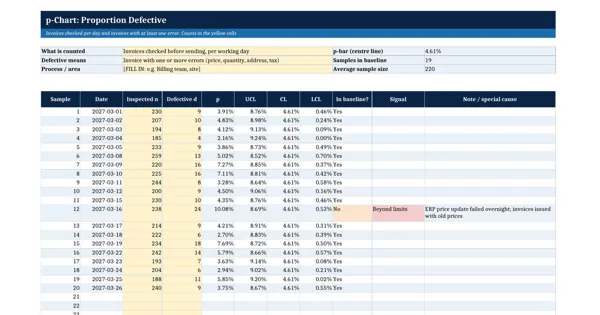
- Worked example: 20 days of invoices checked (180 to 260 a day) and invoices with an error
- p-bar from NIST/SEMATECH 6.3.3.2, with limits recalculated for each sample size
- Negative lower limits set to zero, as is usual for proportion charts
- Signal column flags points beyond the limits and runs of 8 on one side of the centre line
- Baseline column to exclude days with a known special cause from p-bar
- Chart of p, centre line, UCL and LCL plus 20 blank sample rows
How to use it: Count each unit once as defective or not, type the number inspected and the number defective per sample, and review any flagged point before you act on it.
Files & formats
- XLSXp-chart-template.xlsx16 KB
Opens in Microsoft Word or Excel, Google Docs or Sheets and LibreOffice. Delivered instantly from your browser.
Free downloads & full access
Every account gets 3 free downloads. Re-downloading a template you already have does not count. This template on its own is $17.99, and buying it keeps your free downloads for something else. Full access is a one-time $249 for all 300 templates, for life.
Bought with a different email? Open your account and enter your order number.
Licence
Use and adapt the document inside your own organisation or for your own clients. Do not resell or republish the templates themselves.