-
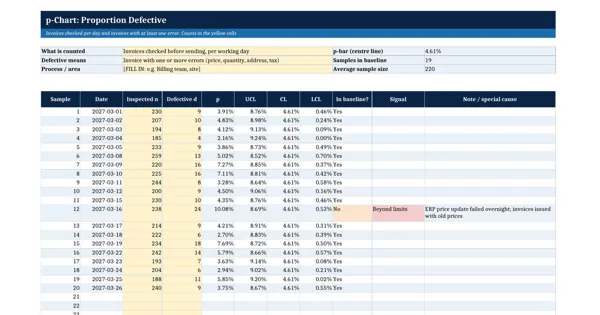
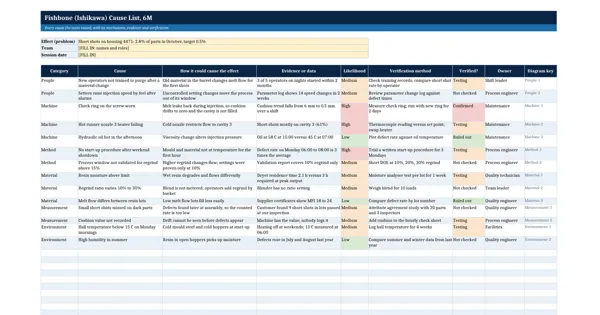
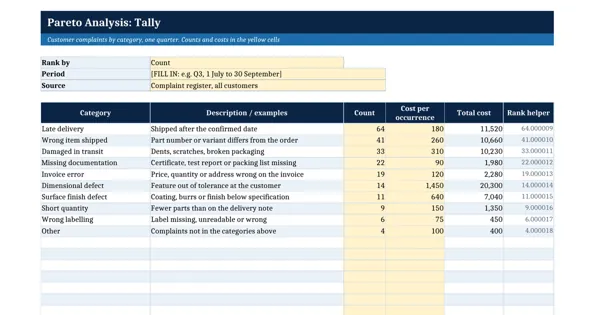
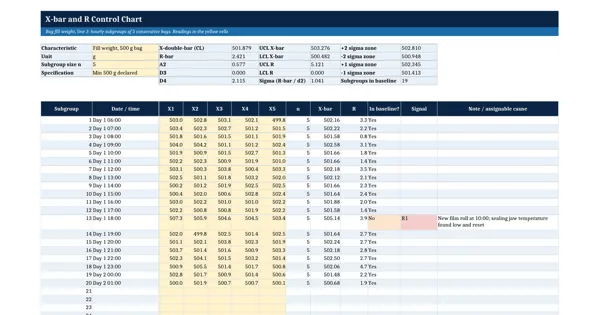 Excel workbook preview
Six Sigma and Statistical Quality
X-bar and R Control Chart Template
3 downloads per free account, no card needed.
Who this is for
A process owner or quality engineer asked to put a key characteristic under SPC after an improvement project, or to show a customer that the process is stable.
What is inside
- Worked example: 20 hourly subgroups of 5 bag fill weights, one flagged out-of-control point
- Control limits from NIST/SEMATECH 6.3.2.1: x-double-bar +/- A2 R-bar, D3 and D4 R-bar
- Baseline column lets you exclude subgroups with a known assignable cause from the limits
- Signal column flags rules 1 to 4 (beyond 3 sigma, 2 of 3, 4 of 5, 8 in a row) per subgroup
- X-bar chart and R chart with centre line and limits, redrawn as you add subgroups
- Constants sheet for n = 2 to 10 and 20 blank subgroup rows
How to use it: Choose rational subgroups (consecutive parts made under the same conditions), type them into the yellow cells and investigate every flagged signal before you recalculate the limits.
Files & formats
- XLSXx-bar-r-control-chart-template.xlsx21 KB
Opens in Microsoft Word or Excel, Google Docs or Sheets and LibreOffice. Delivered instantly from your browser.
Free downloads & full access
Every account gets 3 free downloads. Re-downloading a template you already have does not count. This template on its own is $17.99, and buying it keeps your free downloads for something else. Full access is a one-time $249 for all 300 templates, for life.
Bought with a different email? Open your account and enter your order number.
Licence
Use and adapt the document inside your own organisation or for your own clients. Do not resell or republish the templates themselves.